Here we try and reproduce the potential used by Sanders and Huntley (1976) and give you some idea of what's happening in NEMO behind the scenes. Some basics of orbits are also discussed in previous example-1 and previous example-2
After reading the paper, we create a new file $NEMO/src/orbit/potential/data/sh76.c (typically by cloning another file that closely resembles it, in this case rh84.c). The name "sh76.c" needs to be added to the POT_CC list in the Makefile in that directory. After this the command "make install should install the sh76.so compiled shared object file into $NEMOOBJ/potential. This will make the potential available for future releases of NEMO. The order of the parameters for the common potname=sh76 potpars= keyword are: omega, A, alpha, eps.
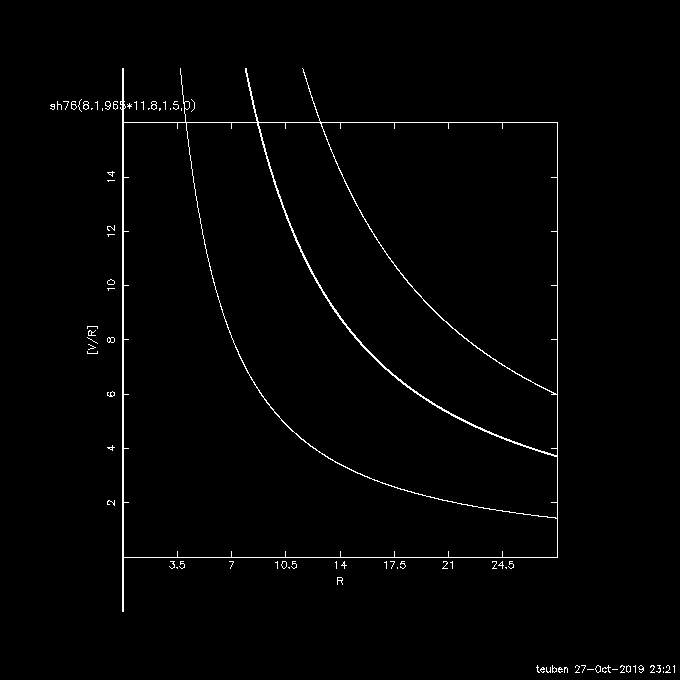
Problem 1: The default parameters seem to give a galaxy with the resonances too far in. After some experimenting multiplying A by about 11.8 seems to give a more reasonably sized galaxy:
  %  rotcurves sh76 '8.1,965*11.8,1.5,0' mode=omega radii=0:28:0.01 yrange=0,16 debug=1

### nemo Debug Info: INIPOTENTIAL Sanders-Huntley 1976
### nemo Debug Info:   Parameters : Pattern Speed = 8.100000
### nemo Debug Info:   A= 11387  alpha= 1.5 eps=0
### nemo Debug Info:   c1= 2.18844 beta= 0
### nemo Debug Info: OLR: 21.9891
### nemo Debug Info: CR: 15.005
### nemo Debug Info: oILR: 7.03018
### nemo Debug Info: iILR: -nan
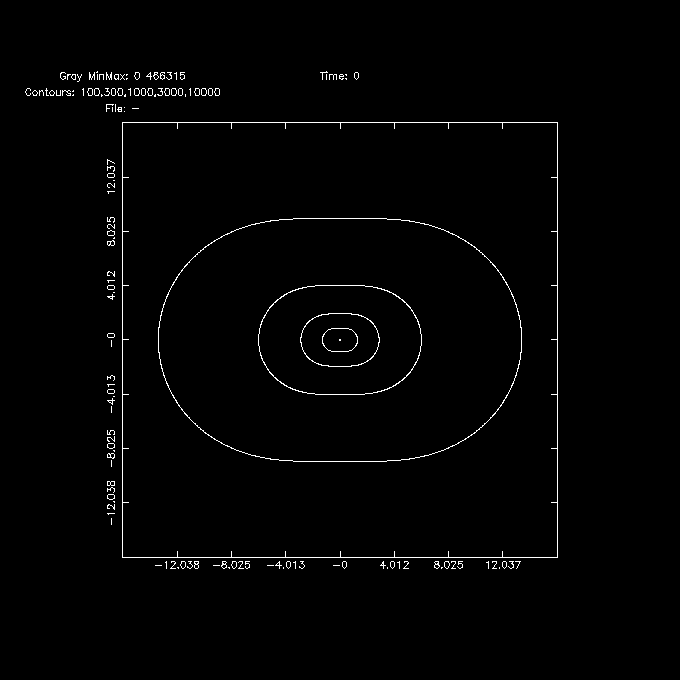
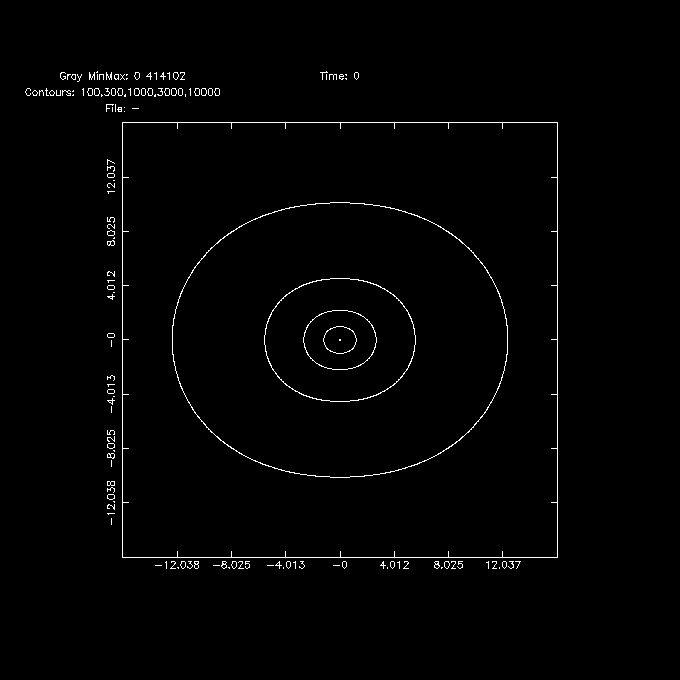
Problem 2: The paper does not give the potential, only the forces. That's ok for orbit calculations, but we cannot check energy conservation. We did add an "un-documented" feature where a negative 5th parameters will trigger that the density (eq (1) in SH76) is returned in the potential slot, so we can make a density plot using the potccd program. For example:
  % potccd - sh76 '0.0,965*11.8,1.5,0.295,-1' x=-16:16:0.1 y=-16:16:0.1  |\
    ccdplot - 100,300,1000,3000,10000

### nemo Debug Info: Creating image 321 * 321 * 1
### Warning [potccd]: SH76:  returning density instead of potential
### nemo Debug Info: using Omega = 0
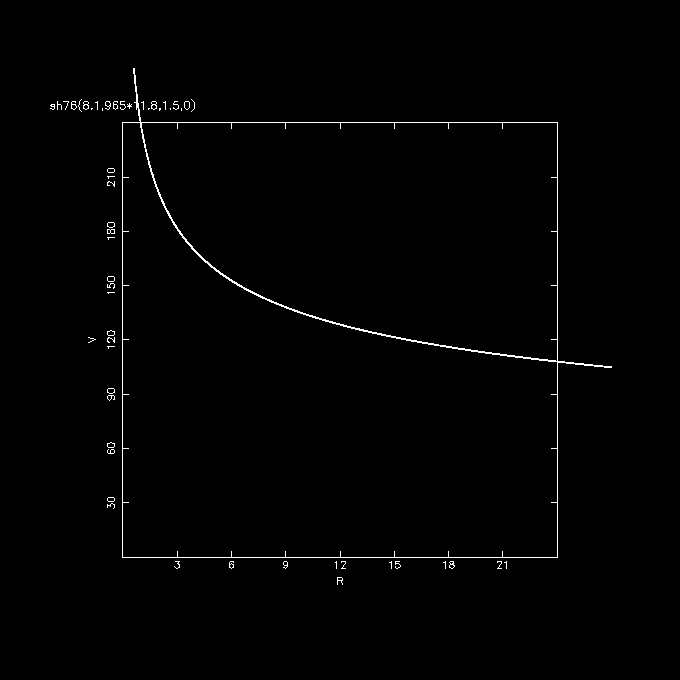
% rotcurves sh76 '8.1,965*11.8,1.5,0' radii=0:28:0.01 yrange=0,240
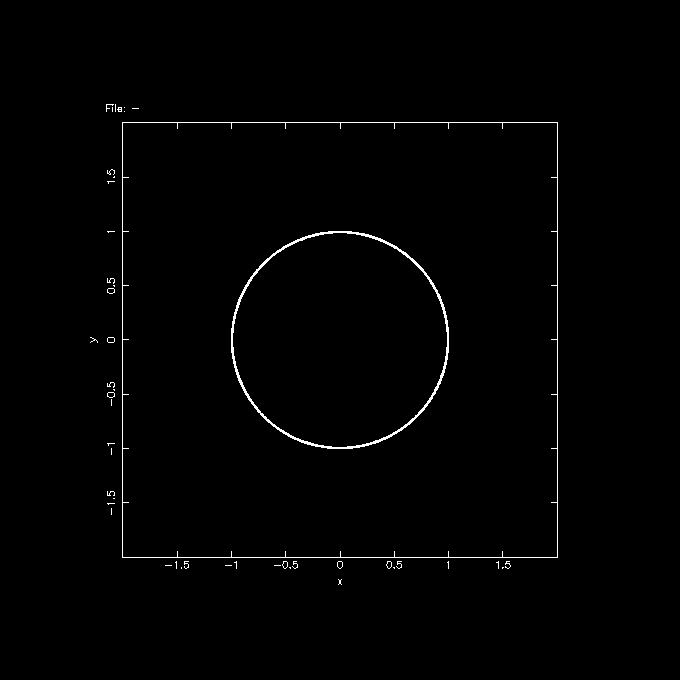
  % mkorbit - 1 0 0 0 230 0 potname=sh76  potpars='8.1,965*11.8,1.5,0' |\
    orbint - - 10000 0.0001 1000 |\
    orbplot - xrange=-2:2 yrange=-2:2
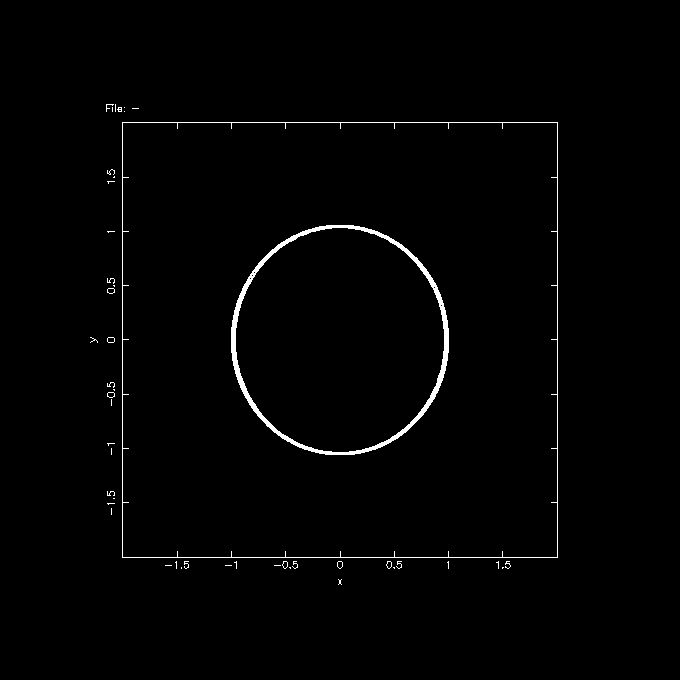
  % mkorbit - 1 0 0 0 245 0 potname=sh76  potpars='8.1,965*11.8,1.5,0.2' |\
    orbint - - 10000 0.0001 1000 |\
    orbplot - xrange=-2:2 yrange=-2:2
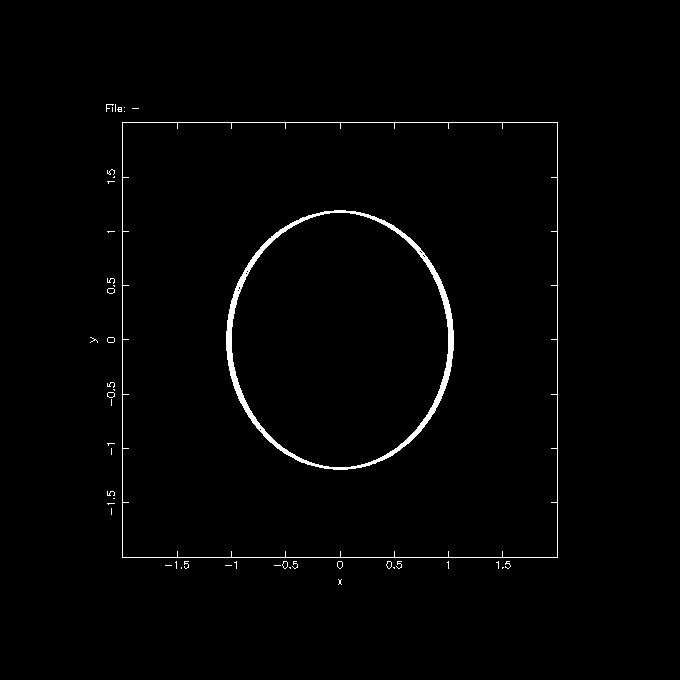
  % mkorbit - 1 0 0 0 270 0 potname=sh76  potpars='8.1,965*11.8,1.5,0.4' |\
    orbint - - 10000 0.0001 1000 |\
    orbplot - xrange=-2:2 yrange=-2:2
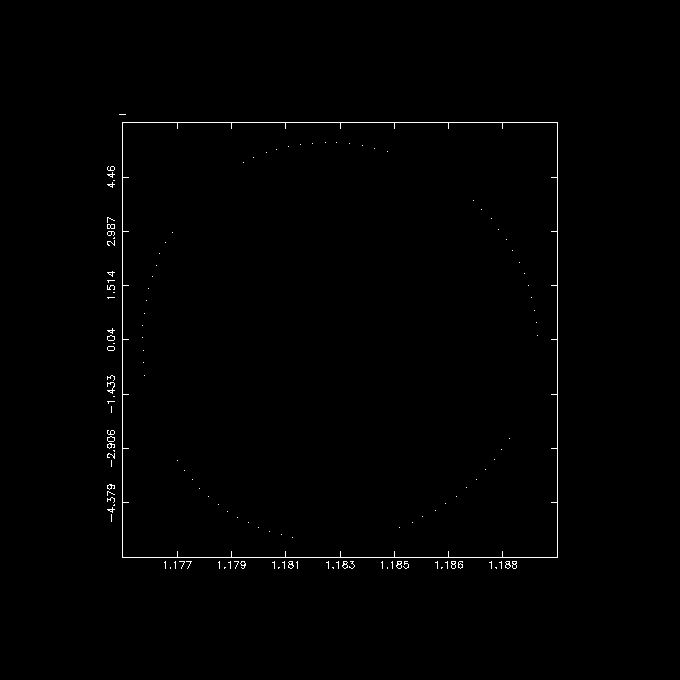
  % mkorbit - 1 0 0 0 270 0 potname=sh76  potpars='8.1,965*11.8,1.5,0.4' |\
    orbint - - 10000 0.0001 0 |\
    orbsos - y |\
    tabplot - 3 4
% perorb dt=0.0001 maxsteps=10000 potname=sh76 potpars='8.1,965*11.8,1.5,0.4' ncross=50 phase=1,270 dir=x | tabplot - 2 3
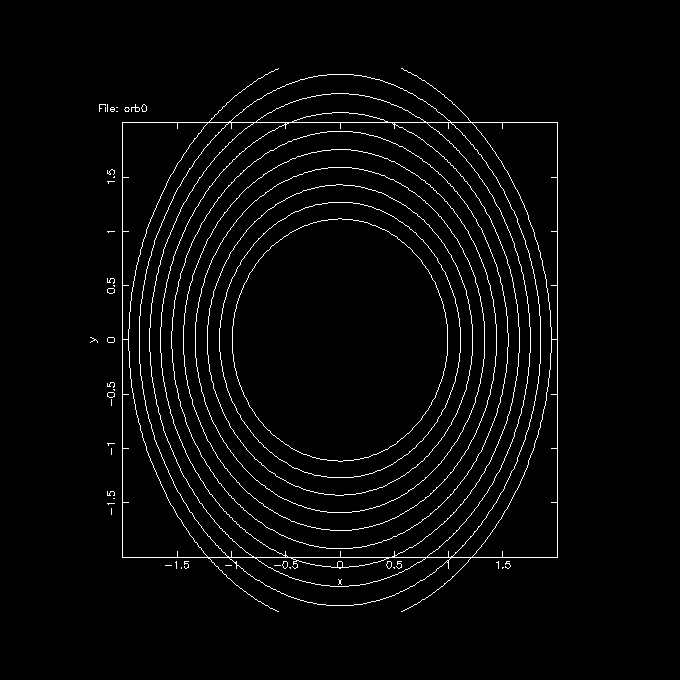
  % perorb dt=0.0001 potname=sh76  potpars='0.0,965*11.8,1.5,0.4'  phase=1,0,0,0,270,0 norbit=10 dir=x out=orb1

  # y0     u0         u1        v1       NPT   NITER PERIOD   ETOT        LZ_MEAN   ETOT_ERR
  0.992588 271.644843 1.113889 -200.325936 143 4 0.028232 -83078.845171 245.656537 0.00160553
  1.108669 268.563156 1.269003 -189.381142 166 4 0.032913 -77456.743488 267.822292 -0.00317724
  1.222255 266.297347 1.427230 -179.499804 190 3 0.037765 -72659.304987 289.032931 -0.00264806
  1.333270 264.676724 1.588607 -170.450549 215 3 0.042784 -68490.603071 309.352932 -0.00214497
  1.441702 263.569643 1.753176 -162.073739 241 3 0.047971 -64814.079946 328.825832 -0.00166559
  1.547513 262.882377 1.921064 -154.254813 268 3 0.053324 -61531.428692 347.479657 -0.00118613
  1.650721 262.537729 2.092457 -146.907531 296 3 0.058847 -58569.720760 365.328086 -0.000630707
  1.751249 262.485872 2.267525 -139.962411 324 3 0.064542 -55873.671985 382.138138 -8.0621e-05
  1.849080 262.682062 2.446281 -133.363212 354 3 0.070413 -53400.289148 398.375205 0.000493367
  1.944113 263.097791 2.629030 -127.067264 384 3 0.076468 -51115.657597 413.545664 0.00116701
  % orbplot orb1
Note this is still in a non-rotating potential. By convention in NEMO rotating potentials the pattern speed is measured counter clock wise, which causes the stable X1 and X2 orbits to have positive angular moments. The X4 orbits have negative angular momentum. To find the extent of the X2 orbits, it is better to launch along the Y axis:
This page was last modified on by PJT.